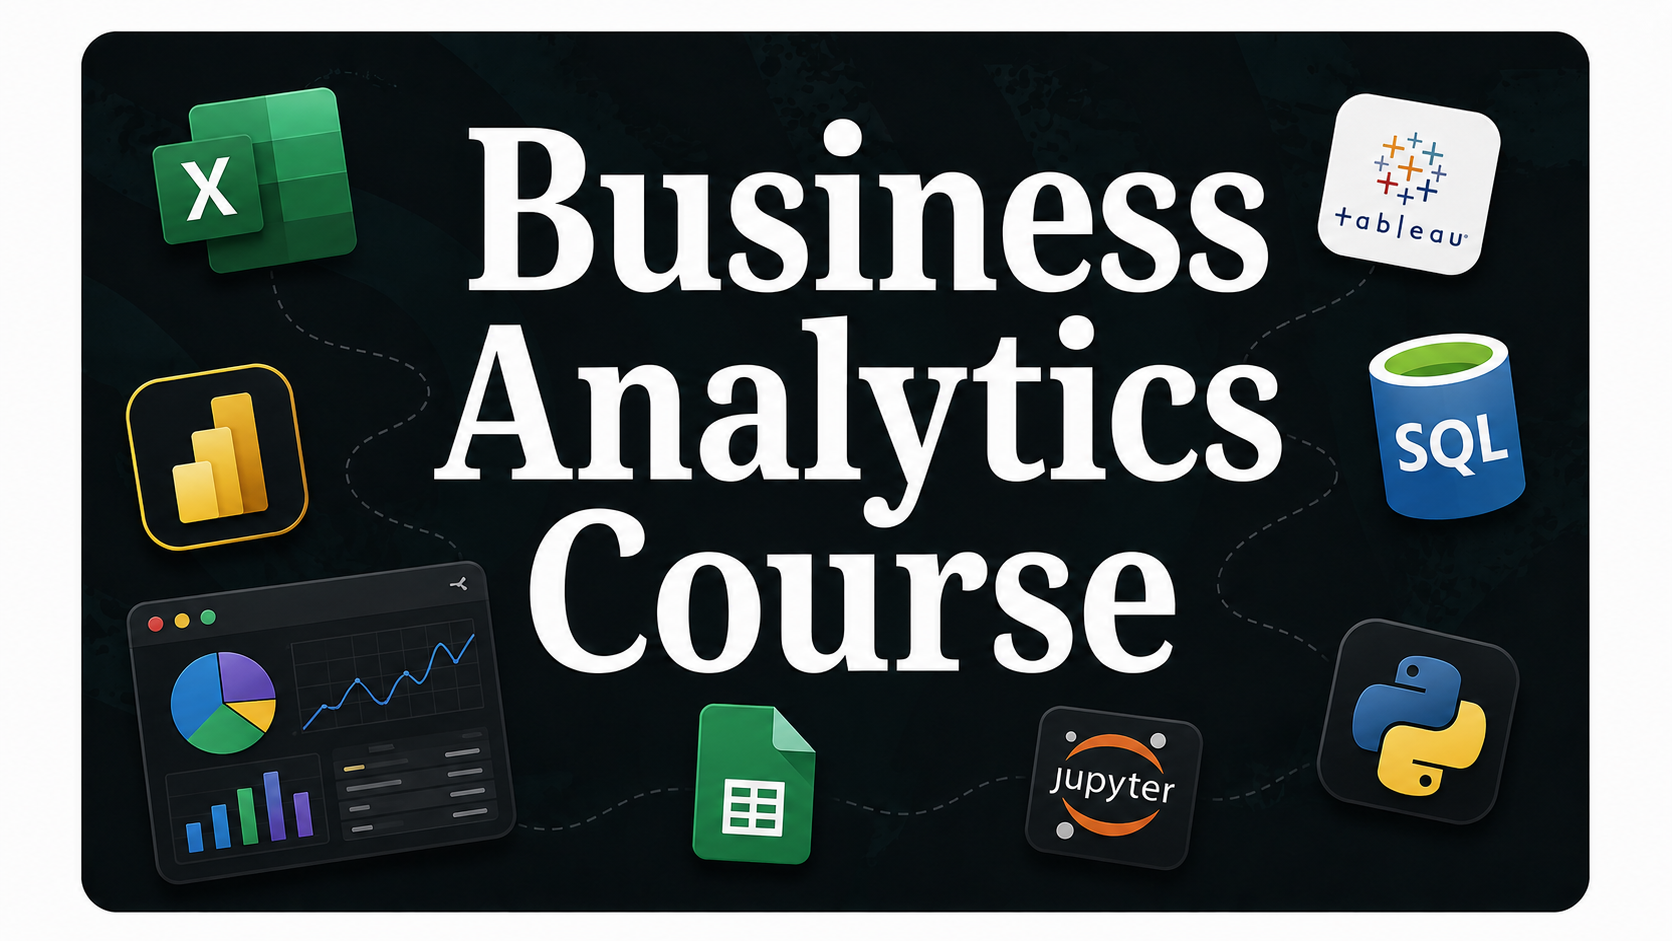

Course Overview
This practical course is designed for students, freshers, professionals, entrepreneurs, and aspiring analysts who want to learn how to turn business data into meaningful insights and smarter decisions.
Throughout the course, you’ll learn the fundamentals of Business Analytics, including data collection, data cleaning, analysis, visualization, reporting, dashboard creation, KPIs, and business intelligence. You’ll understand how businesses use data to identify trends, measure performance, solve problems, and improve decision-making.
With hands-on exercises and real-world business scenarios, you’ll develop practical analytical skills and learn how to present data clearly through interactive dashboards and reports.
What You’ll Learn
-
Understand the fundamentals of Business Analytics and Business Intelligence, Collect, clean, organize, and analyze business data effectively, Perform data analysis using Excel and SQL, Create interactive dashboards and meaningful data visualizations, Track and interpret KPIs, trends, and business performance, Generate clear business reports and actionable insights, Apply analytics to real-world business problems and decision-making.
Tools Covered
- Microsoft Excel, SQL, Power BI, Tableau, Google Sheets, AI Tools